
DIALS example job: MX data reduction and integration
Introduction
DIALS (Diffraction Integration for Advanced Light Sources) is a modular toolkit for diffraction data processing. It is used for integrating crystallographic data from area detectors and supports advanced features such as experimental geometry refinement, symmetry analysis, and scaling.
This example job template has been built with the DIALS environment and demonstrates how to run a simple DIALS-based pipeline as a Job on DECTRIS CLOUD, starting from raw diffraction images and producing integrated, scaled, and merged data, together with preview images and processing reports.
The template automatically:
- Imports raw diffraction images into a DIALS experiment list.
- Generates PNG previews of the first and last diffraction frames.
- Performs spot finding, indexing, refinement, integration, symmetry determination (If space group is not given or is not P1), scaling, and merging.
- Produces summary plots and a DIALS HTML report.
- Monitors resource usage throughout the job (CPU and memory).
Quick Start
To run this job, define the following required input:
- DC_PATH: Path to the folder containing your diffraction images.
Example:/dectris_data/DECTRIS/2025/23393/raw/ALS831_pilatus_1/data/
These following optional parameters allow customization of processing and monitoring. If a variable is left at -1, it will be ignored.
- DC_NPROC: Number of parallel processes to use for spot finding and integration.
Example: 8 - DC_INDEX_METHOD: Indexing method to use.
Allowed values:fft1d,fft3d,real_space_grid_search - DC_UNIT_CELL: Fix a unit cell as six comma-separated values
a,b,c,α,β,γ
Example:78.3,94.1,101.2,90,90,90 - DC_SPACE_GROUP: Fix the space group (otherwise Bravais refinement is performed).
Example:P212121 - DC_MON_INTERVAL: Sampling interval for resource monitoring in seconds.
Example:5
Output
A successfully completed job will generate the following outputs:
The following files will appear in the job’s output directory:
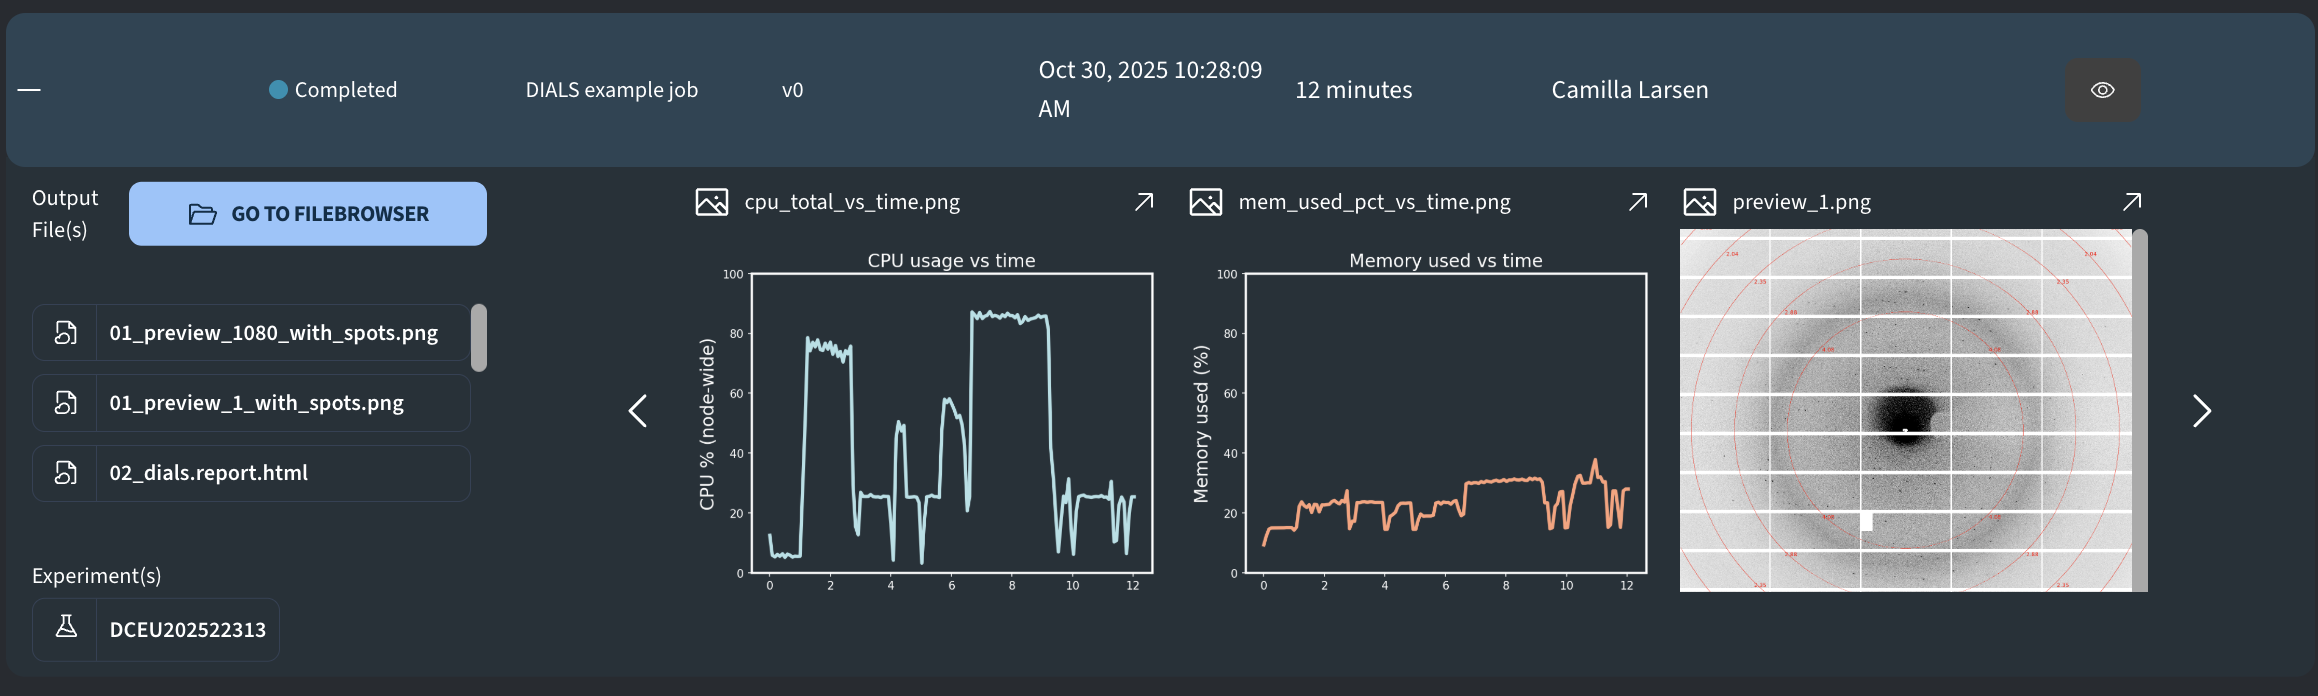
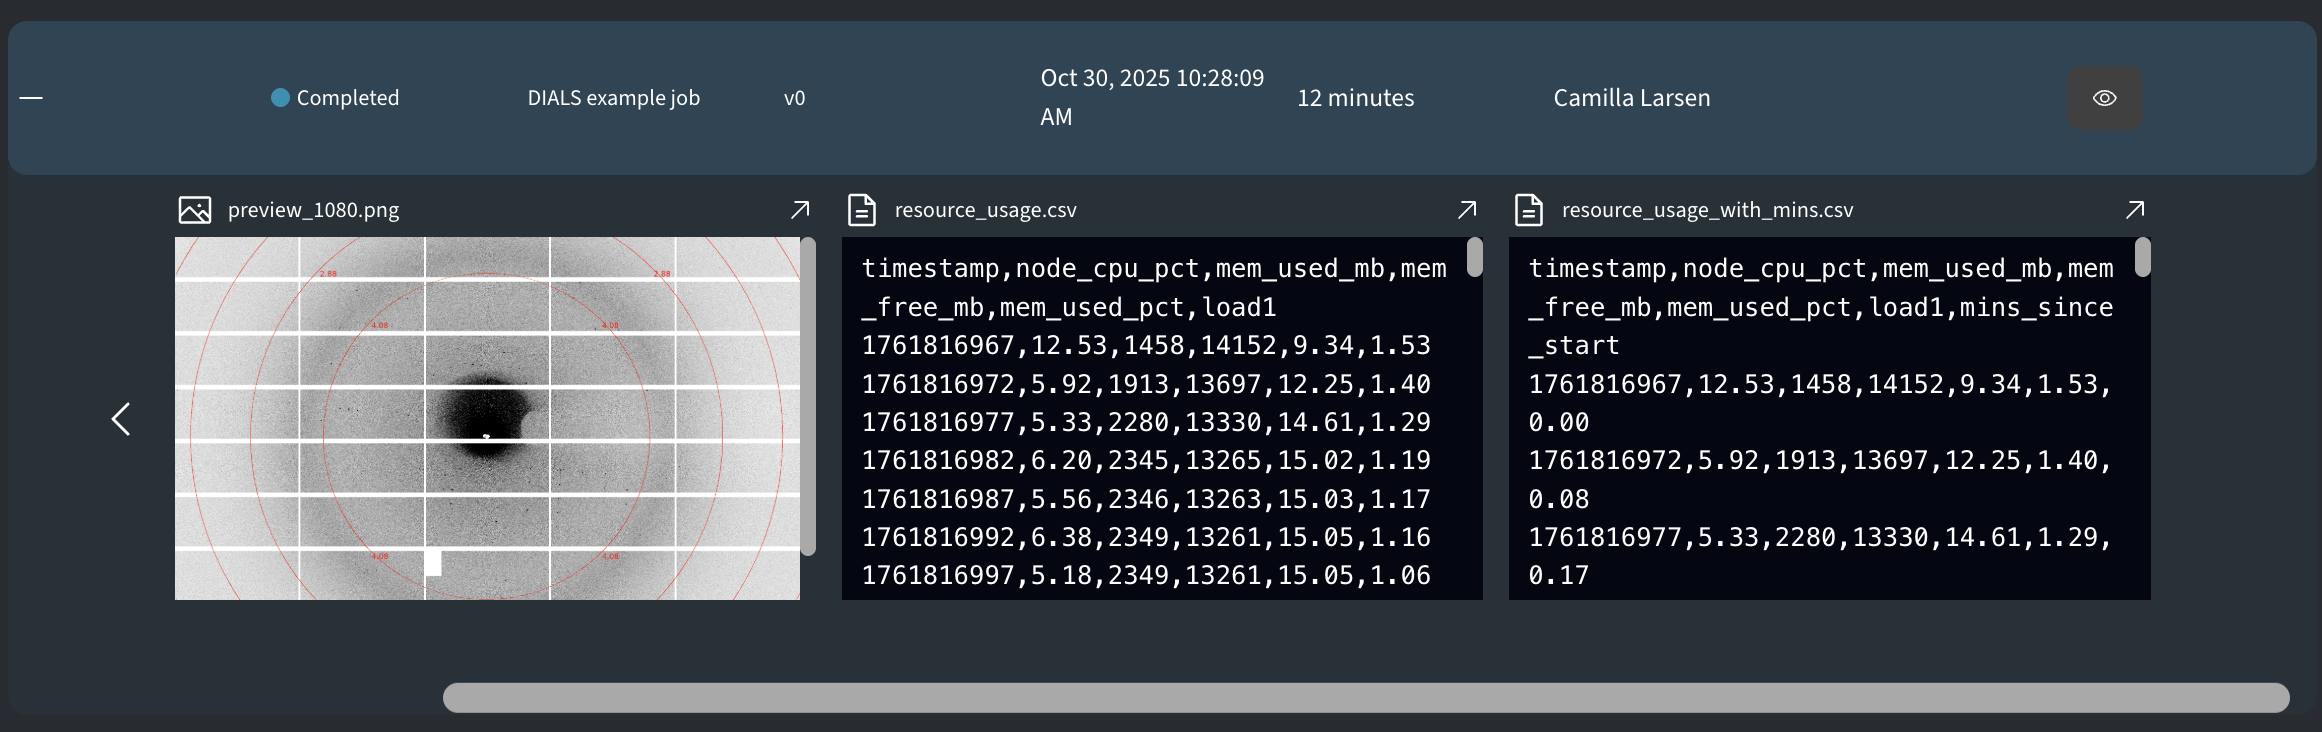
- preview_<first>.png, preview_<last>.png: Exported bitmaps of the first and last image in the dataset.
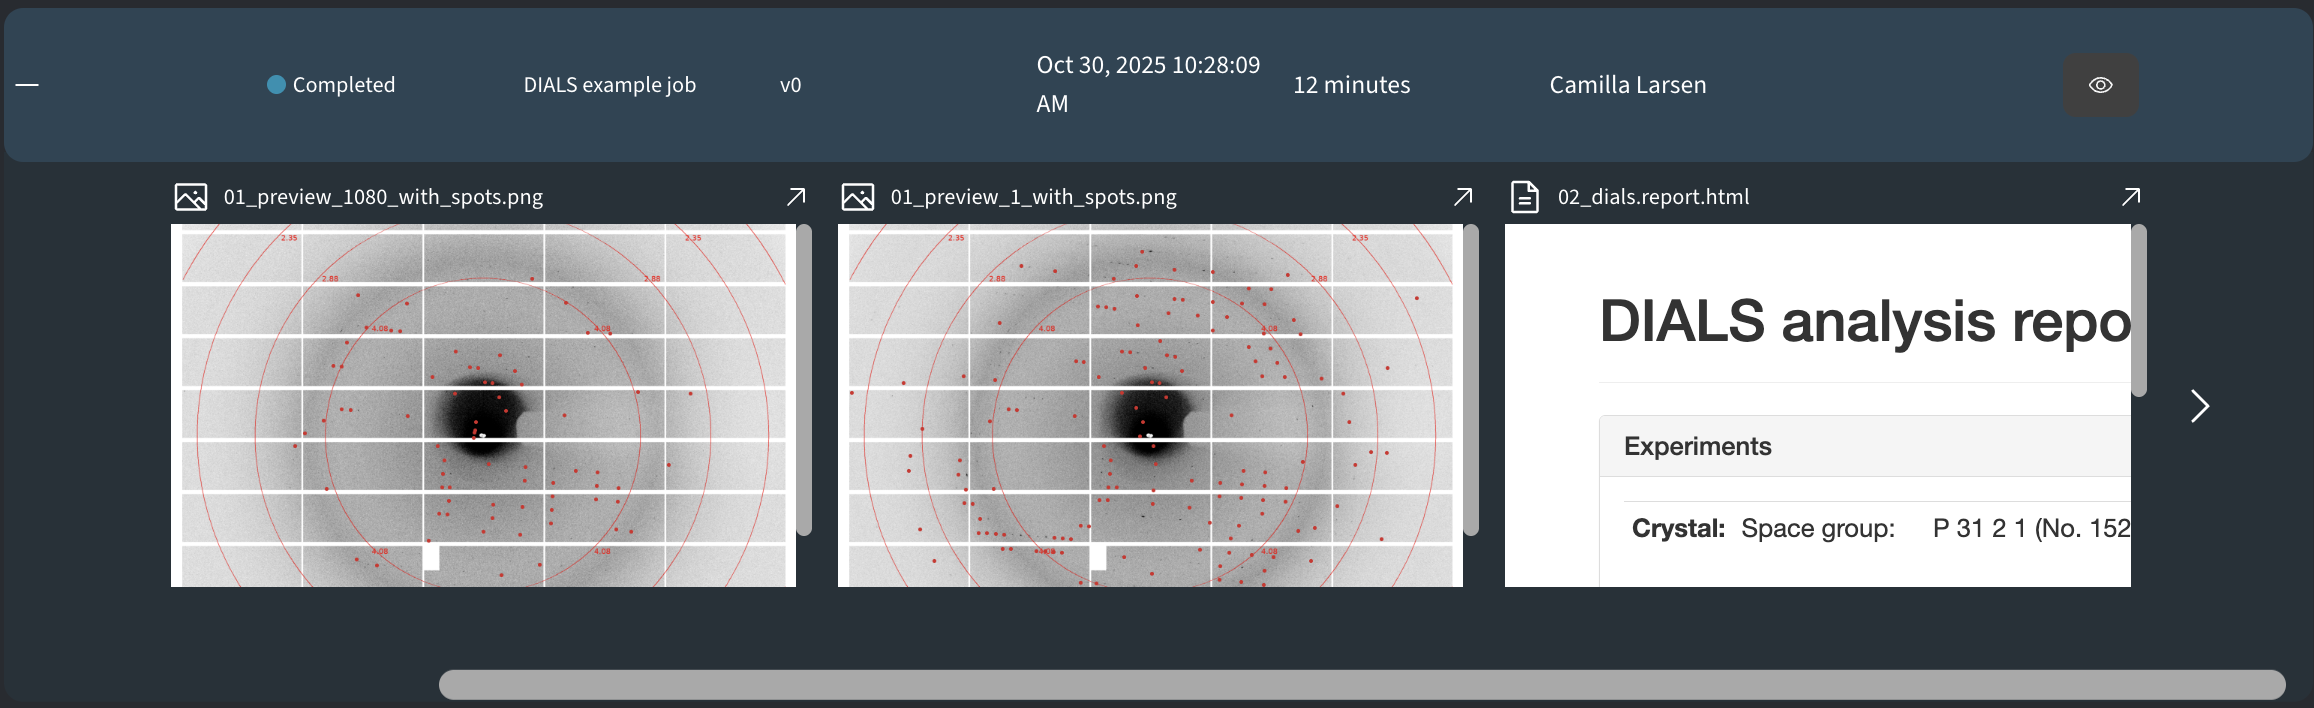
- 01_preview_<first>_with_spots.png, 01_preview_<last>_with_spots.png: Exported bitmaps of the first and last images in the dataset, with the spots from the find_spots step superimposed.
- 02_dials.report.html: Final report summarizing the DIALS results.
- cpu_total_vs_time.png: Plot of total CPU usage as a function of time.
- mem_used_pct_vs_time.png: Plot of total memory usage as a function of time.
- resource_usage.csv: Log of resource usage (CPU %, memory, load) over time.
- resource_usage_with_mins.csv: Same as above, with elapsed minutes added.
The output directory will also have a subdirectory dials_output, which includes all the output from the DIALS run, including merged.mtz as well as html reports from the different steps.
Versions
- Version 0: Initial version created with version 1 of the DIALS environment.